Debugging of JavaScript
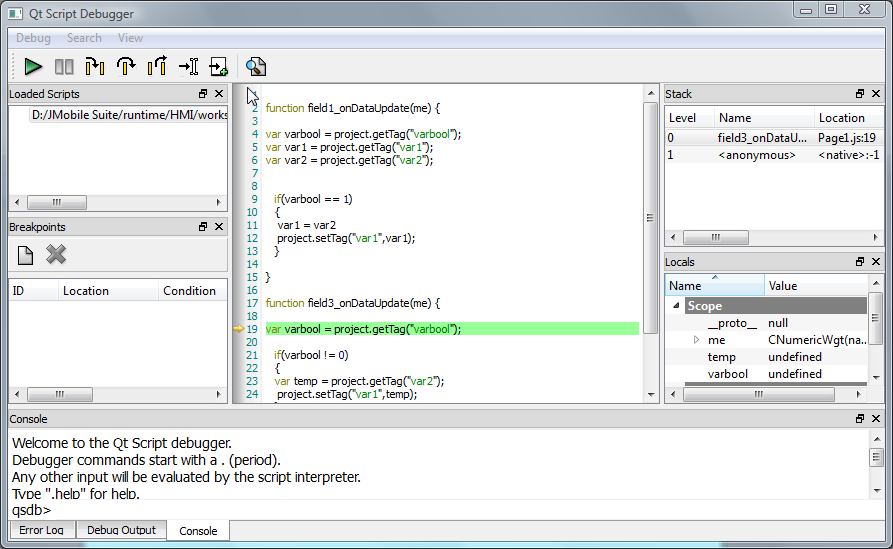
JMobile Studio and JMobile HMI Runtime include a JavaScript debugger.
Two types of debuggers are available:
- Runtime debugger: a debugger running directly on the HMI device
- Remote debugger: a debugger running on a remote computer connected to the HMI device via Ethernet (usually computer running JMobile Studio)
Enabling debugging
In the Properties pane of a page, set JavaScript Debug to true.

For schedulers and alarms debugging, enable JavaScript Debug in Project properties.
In the JMobile HMI Runtime, when the events are called, the debugger will show the debug information. In the Locals pane you can inspect all variables and elements.

For a complete reference guide about JavaScript Debugger refer to :
http://qt-project.org/doc/qt-4.8/qtscriptdebugger-manual.html
Remote JavaScript Debugger
Path: Run> Start JS Remote Debugger
- Set the Allow JavaScript Remote and the JavaScript Debug parameters in the project Properties to true in all the pages where debugging is required.
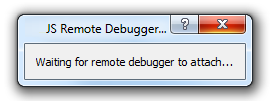
- Download the project: the following message is displayed on the runtime.

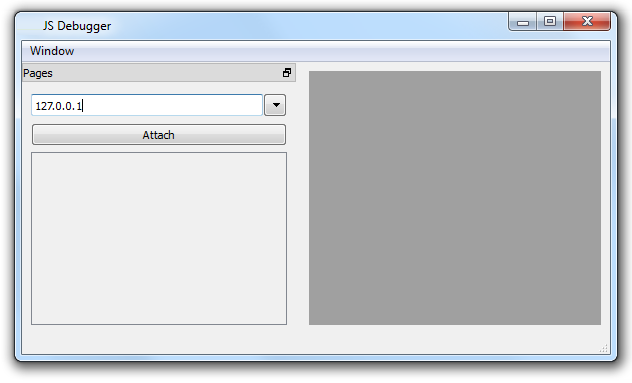
- In the JS Debugger window, select the IP of the HMI device and click Attach to connect the debugger to the HMI device.

Remote JavaScript debugger connects to JMobile HMI Runtime using port 5100/TCP.
Note: The Remote JavaScript debugger tool is not supported in HMI Client.
JavaScript Memory Usage
When the memory exceeds the maximum, an out of memory exception is thrown with a custom message. Please note that we do not have a fine control over the actual memory usage so it is mainly a soft limit. Moreover we can't forbid the allocation (this will break the engine implementation), so exception is thrown only when the memory is already over the limit. Before raising the exception, a garbage collection is forced to see if some memory can be freed.
JavaScrip memory limit can be accessed from the global object $EngineMemory. The default is 16MB, which should be enough for the typical JavaScript usage (mainly control, without many allocations).
- $EngineMemory.setLimit()
set maximum memory allowed for JavaScript (the default limit is 0x00FFFFFF) - $EngineMemory.getLimit()
get maximum memory allowed for JavaScript - $EngineMemory.getSize()
get currently used memory from JS (fastMallocStat)
Test memory exception
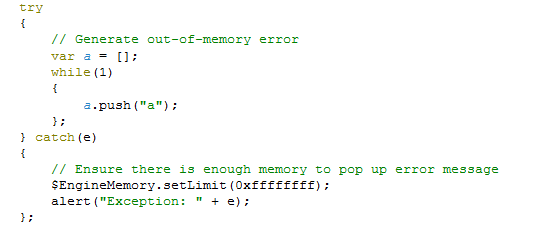
To generate and test memory exception you can use the following snipped. Please note that we need to reset the memory limit to 0xffffffff to be able to run the alert, otherwise the memory allocations required to pop up the alert would fail.
